Why OEE Tracking Is Needed?
An OEE score of 85% or higher is considered world-class in manufacturing, while scores between 60–85% are typical and indicate areas for improvement. Scores below 60% suggest poor performance and significant productivity losses.
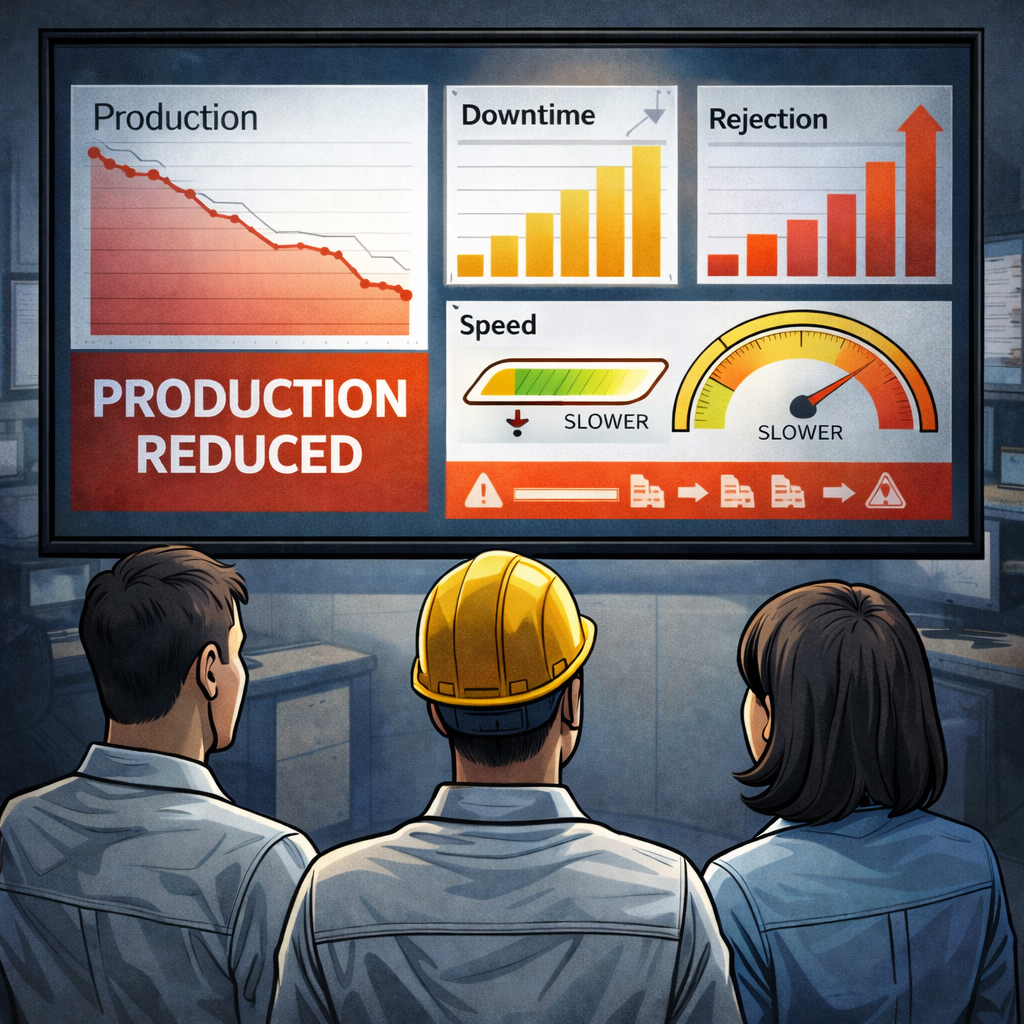
Without OEE tracking, factories often miss hidden losses, making it hard to make data-driven decisions. Regular monitoring helps prioritize maintenance, optimize schedules, and improve productivity. While 100% OEE is nearly impossible due to unavoidable delays and quality issues, a practical target is 70–85%, with ongoing efforts to improve each OEE component.
Implementing OEE tracking also builds a culture of continuous improvement on the shop floor. It encourages operators, engineers, and managers to collaborate, fix problems faster, and celebrate small wins. With clearly visible metrics, everyone knows where they stand and what needs attention. This shared ownership leads to better morale, increased accountability, and a more efficient, competitive manufacturing process.
OEE is calculated as the product of three critical factors.
Availability
Measures the percentage of scheduled production time that is actually productive.
A = Actual Run Time / Planned Run Time
This tells you how much of the scheduled time the machine was actually working. If there were breakdowns or setup delays, availability goes down.
Performance
Reflects whether the equipment is operating at its optimal speed.
P = (Ideal Cycle Time × Total Count) / Actual Run Time
This shows how fast the machine was running compared to its best possible speed. If the machine ran slower than ideal, performance drops.
Quality
Assesses the proportion of good units produced out of the total units manufactured.
Q = Good Qty Produced / Total Qty Produced
This tells you how many of the items produced were without defects. If many items had issues, quality decreases.
Overall Equipment Effectiveness
Measures the overall Effectiveness of a manufacturing process by combining availability,performance, and quality into one metric.
OEE = (Availability × Performance × Quality) x 100
OEE% shows how effectively a machine or process is being utlized compared to its full potential.
How is OEE Calculated?

Benefits Of OEE !
Maximize productivity
by identifying exactly where productivity is lost, whether from downtime, slow performance, or quality issues.
ROI (Return of Investment)
OEE can help to produce more products with same equipment and resources with the same amount of time. Just improve the process and get more return.
Reduce Maintenance Cost
Using OEE data, Upcoming maintenance can easily be predicted. This helps in maintenance cost cutting and improves machine health.
Maximize Resource Productivity
Uncover productivity data and identify long cleanup, setup and startup times. This helps to take a decision where you need to add or remove the resources.
No more guesswork
OEE insights empower teams to take the right steps to maintain optimal operation and ensure that resources are used wisely.